Our responsibility
Sustainable and ethical action is a matter of course for us.
Learn more
Equities
Equities are analysed in a wide variety of ways. Major investment houses conduct primary analyses, i.e., they prepare their own estimates of the business development of companies, based on factors that include conversations with decision-makers. Others conduct fundamental analyses and use publicly available data to determine the fair value of shares. Yet again others focus on technical analysis, for example by studying charts and sentiment. As a rather small house, we rely on quantitative analysis for equity selection. With electronic support, quantitative analysis allows us to evaluate a large number of companies with relatively little effort, taking into account both fundamental and technical aspects. For instance, we are able to give an assessment of all the companies included in the Stoxx Europe 600. We distinguish between recommendations to buy (strong buy and buy), to hold (overweight, neutral, underweight) or to sell (sell). Eight years ago, we defined the relevant indicators and have had good experience with them ever since. Thanks to our precisely defined evaluation criteria, we can also determine the more distant past using backtesting.
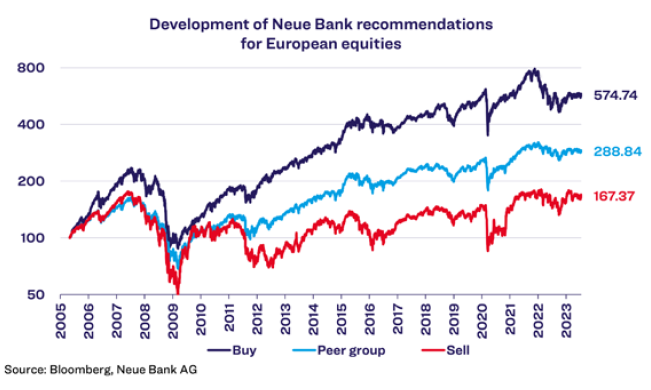
As the chart shows, equities with buy recommendations performed best (+474.74% since May 2005). In contrast, equities with sell recommendations were also positive over the past approximately 18 years, but with significantly lower performance at +67.37%. Of course, the recommendations do not work equally well in all market phases. For instance, the losses of the buy recommendations in 2022 were greater than those of the more poorly rated equities. In the long run, however, the results are very good, or in other words: our road leads to Rome. As the comparison with our peer group indicates, our road is indeed quite successful, as shown by our buy recommendations, which perform significantly better. The peer group is made up of all Liechtenstein UCITS funds in this segment that were issued over the entire term, excluding costs, to ensure a fair comparison.
Economy
Because official recessions are usually announced with a delay of several months, financial market players try to detect them at an early stage using a wide variety of indicators. This is because most market corrections are associated with economic downturns. As a rule, equity markets tend to suffer setbacks even in the run-up to a recession. Conversely, equities often recover even before the economy picks up again. These cycles are illustrated in the following chart.
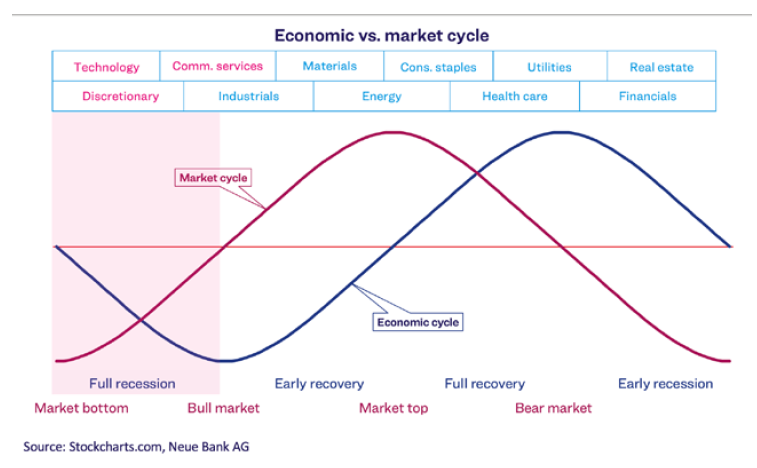
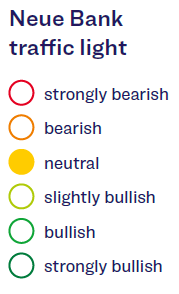
Sectors likewise develop differently depending on the economic phase. Defensive sectors, such as consumer staples and health care, can lend stability to a portfolio in a bear market. Swiss investors see this time and again when the domestic benchmark index – in which these sectors are weighted at over 60% – out-performs other country indices during crises. On the other hand, some sectors pick up especially strongly after bottoming out. In the first half of the year in the United States, the technology (+40.53%), communication services (+34.96%), and consumer discretionary (+31.96%) sectors gained the most. These are the sectors that typically already start to recover while still in a recession. According to the chart above, this would imply that we are already in a recession. However, the labour market in particular does not confirm this state of the economy, given that the unemployment rate is still close to its lows. A look at the Neue Bank traffic light also still calls for caution.
Bonds
Inflation continues to drop in industrialised countries, even if it has not yet reached the target of 2% per year, with the exception of Switzerland. This limits expectations of further interest rate hikes, which in turn increases the attractiveness of bonds.
Currencies
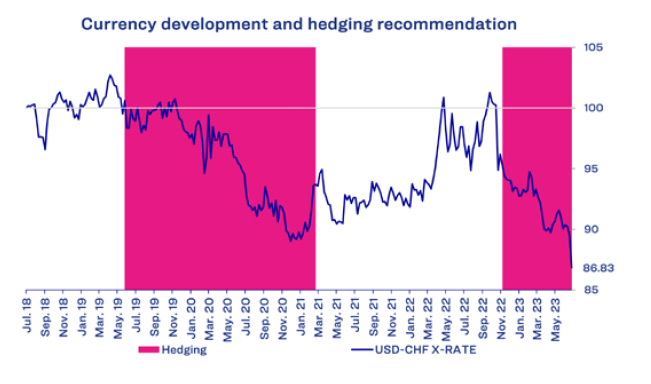
In July, the USD lost significant value against the CHF. The reason for the correction was the sharp decline in inflation figures in the United States, which reduced expectations of further interest rate hikes. We use our currency indicator to manage foreign currencies. The indicator aims to reduce the negative impact of major setbacks on the portfolio. As the chart above shows, we have been hedging USD since the fourth quarter of 2022, which has reduced foreign currency losses. As the chart also shows, we would have suffered a currency loss of more than 13% on USD investments over the past five years without hedging.
Alternative investments
At the beginning of July, we adjusted our satellite position in alternative investments. We are newly invested in listed private equity and have taken profits on our tactical gold position. While the gold price in USD has gained a little more than 8% since the beginning of the year, the gain in CHF is not even 1%.