Our responsibility
Sustainable and ethical action is a matter of course for us.
Learn more
Equities
We are often asked why the Neue Bank traffic light is not yet red, even though there has already been a significant market correction. In fact, we’ve already passed through a significant setback – but as the chart below shows, the setback in 2008 during the Great Recession (analogous to the Great Depression of 1929) was even more pronounced.
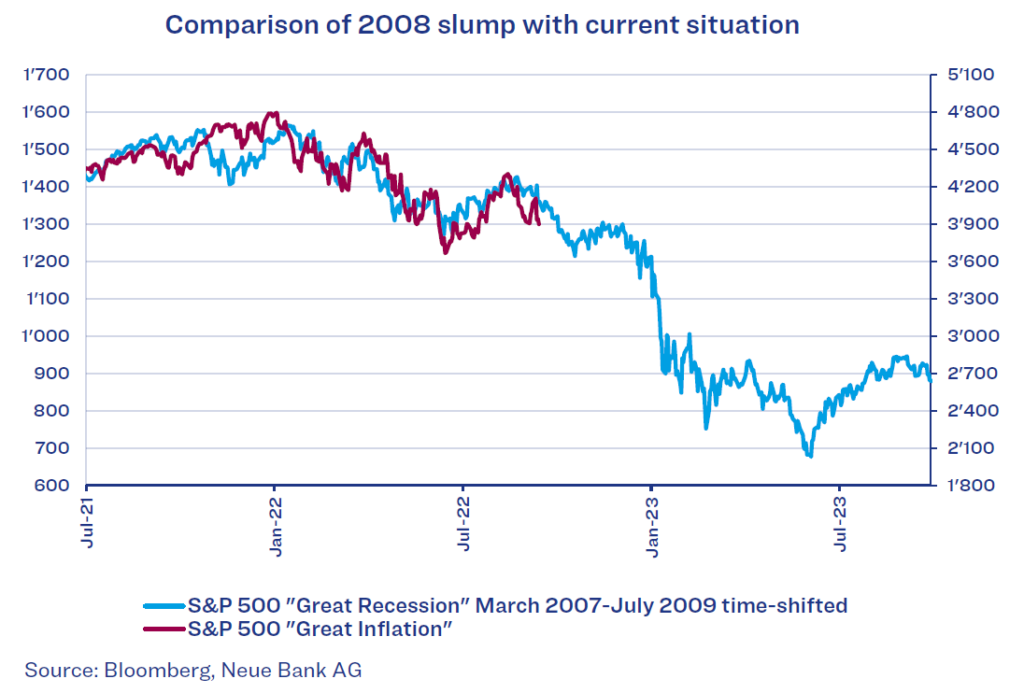
It’s often forgotten that statistically speaking, a correction of more than 10% occurs in significantly more than every second year. But because not even every fifth year exhibits negative performance, it is always important to keep in mind that declining prices may also be just a dip in an upward trend. What is the situation now? Our traffic light is still yellow/amber. Several key figures that influence the traffic light have already reacted (otherwise the traffic light would be green). Because the traffic light takes different data into account, it is possible and intended that not all signals occur at the same time, but rather that in the ideal case, some indicators react already before a possible turning point, leading to a reduction of equity exposure. Other indicators are intended to confirm a bear market after the peak has occurred, triggering a further reduction in equity investments. We have not yet received this confirmation. A look behind the scenes does show, however, that not much is missing by some measures, and that the traffic light signal might soon turn to red.
Economy
Although the purchasing managers’ indices for manufacturing have declined significantly, they do not point to a recession in all regions. In the United States, for example, the level is still above 50, signalling positive growth. Other economic data look worse, however. Our economic indicator for the United States also predicts a recession.
Bonds
The inflation trend is still one of the main topics on the financial markets. When the latest US inflation figures were higher than expected, this once again shook up the financial markets. As always, investors are looking for suitable indicators from which future developments might be derived. These include the NFIB small business price plans, which may indeed have a certain predictive power. In the chart below, we compare them with the US consumer price index.
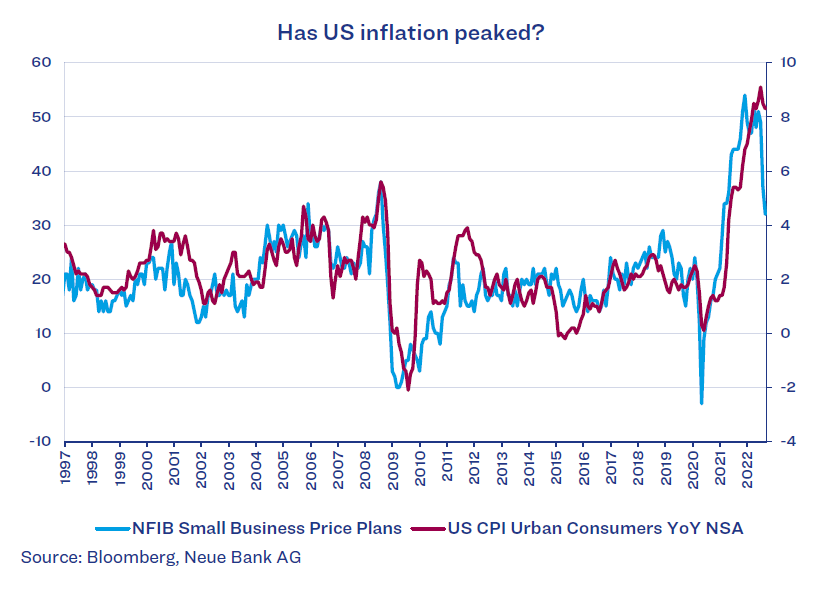
As the chart shows, the progression of the two lines is quite similar, and it is easy to see how the price plans of small businesses always react a few months in advance. This is the case now as well, indexing a decline in inflation to the 4% range. Nevertheless, further interest rate hikes by the US Federal Reserve are expected. How quickly the situation in Europe eases also largely depends on the extent to which the winter can be survived without energy shortages. Due to the rise in inflation, inflation-linked bonds have lost significantly less this year than conventional bonds with the same maturity. We believe diversification into inflation-linked bonds is generally advisable. In fact, we already further increased that exposure at the end of 2021. We advise against choosing long maturities, however, given that the duration effect otherwise clearly outweighs inflation protection.
Currencies
Alongside the EUR/CHF, the GBP/CHF also tended to weaken in recent weeks and months. Since the beginning of the year, the British currency has lost more than 11% against its Swiss counterpart. Thanks to our currency indicator, we already hedged GBP equity positions in CHF portfolios at the end of last year. The long-term trend of GBP against CHF is also clearly negative. In the 1970s, the exchange rate was still over 10.00, but it has since fallen to 1.10. This clearly shows how strongly investments in foreign currencies can influence investment performance. A clearly defined currency strategy and tactics are therefore indispensable.